This brief case report shows an example for performance gains that can be achieved in C and C++ by simple analysis and code restructuring. It does not describe performance optimization in detail.
As additional reading I recommend Data Oriented Design Resources and especially the talks of Mike Acton, e.g. Code Clinic 2015: How to Write Code the Compiler Can Actually Optimize.
In this tutorial we use the profiler of the Visual Studio 2015 Community Edition (recommended:
Beginners Guide to Performance Profiling).
At the time of writing I am working on a Deep Learning based synthesizer for VocaliD. For running on weak and older devices, I had to take a number of measures to ensure adequate performance. Interestingly, in most cases the DNN wasn’t the actual bottleneck but pre- and postprocessing via 3rd party libraries.
But let’s get started.
Measuring via timestamps
A simple approach is to just get timestamps at different stages in your code and output the deltas. The biggest advantage of this method is that you can easily run your binary on a number of test devices and gather timing data without the need for profiling tools. You can then analyze the timing data with other tools of your choice (e.g. SciPy, R, Excel…) on a development machine.
A straightforward and simple utility is shown here:
#include <chrono>

class Timer {
std::chrono::steady_clock::time_point begin;

public:
Timer() {
Reset();
}

void Reset() {
begin = std::chrono::steady_clock::now();
}

long long ElapsedMilliseconds() {
return std::chrono::duration_cast<std::chrono::milliseconds>(
std::chrono::steady_clock::now() - begin).count();
}
};
And an example usage:
#ifdef DNN_DO_PROFILING
#define DNN_PROFILE_TIMER(var) Timer var;
#define DNN_PROFILE_LOG(txt) std::cout << "[DNN-PROFILER] " << txt << std::endl;
#else
#define DNN_PROFILE_TIMER(var)
#define DNN_PROFILE_LOG(txt)
#endif

{
DNN_PROFILE_TIMER(postprocessingTimer);
postprocessing();
DNN_PROFILE_LOG("Time for postprocessing (MLPG + transformation): " << postprocessingTimer.ElapsedMilliseconds() << "ms.");
}
I did that at a few keypoints and it revealed that a disproportionate amout of time was spent on postprocessing.
Actually a large chunk of CPU was wasted on the Maximum Likelihood Parameter Generation (Speech parameter generation algorithms for HMM-based speech synthesis) that was done via SPTK.
Profiling by sampling
To get a clearer picture, we’ll use the set of profiling tools that come with Visual Studio.
I recommend taking a look at Beginners Guide to Performance Profiling.
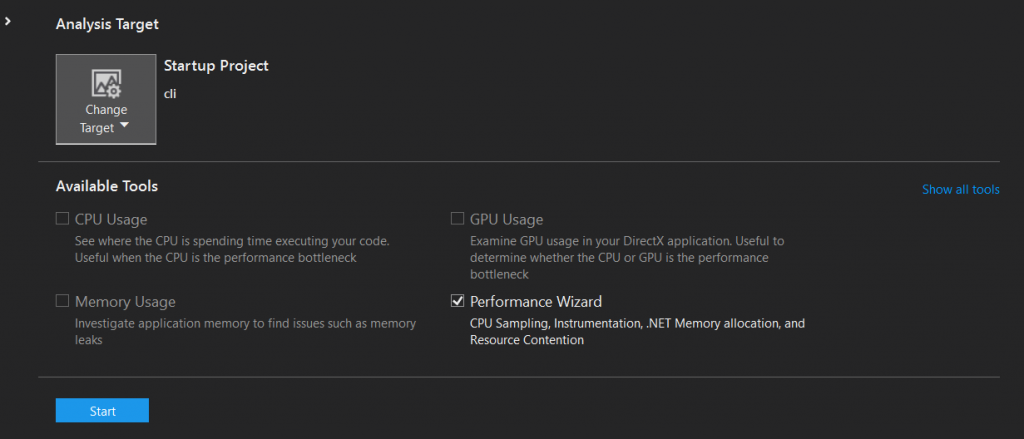
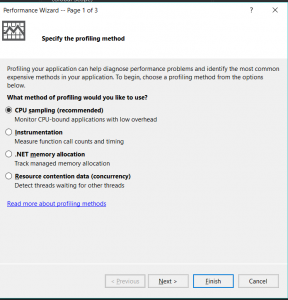
So first, startup a new profiling session by pressing ALT+F2, select the performance wizard, push “Start” and then select “CPU Sampling”:

Running the profiler in VS 2015

Select CPU Sampling
CPU Sampling works by stopping the process at regular intervals and storing the current position of the call stack.
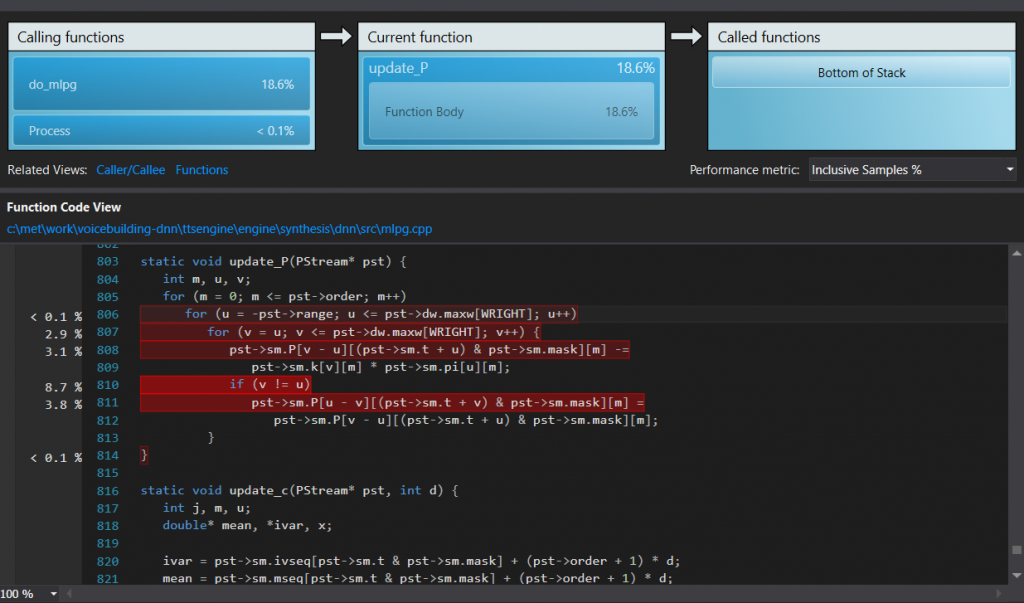
After running it, the profiler will show you a general report and the hot path. In our case, the hot path revealed a function “update_P” that ate a huge part of our CPU time. Clicking on a function shows a detailed report:

Function detail
Optimization
As already mentioned, update_P is a function from SPTK and what we are doing now is a bit of blackbox optimization. We optimize this function without actually figuring out what it does. Here it is again:
static void update_P(PStream* pst) {
int m, u, v;<span data-mce-type="bookmark" style="display: inline-block; width: 0px; overflow: hidden; line-height: 0;" class="mce_SELRES_start"></span>

for (m = 0; m <= pst->order; m++)
for (u = -pst->range; u <= pst->dw.maxw[WRIGHT]; u++)
for (v = u; v <= pst->dw.maxw[WRIGHT]; v++) {
pst->sm.P[v - u][(pst->sm.t + u) & pst->sm.mask][m] -=
pst->sm.k[v][m] * pst->sm.pi[u][m];
if (v != u)
pst->sm.P[u - v][(pst->sm.t + v) & pst->sm.mask][m] =
pst->sm.P[v - u][(pst->sm.t + u) & pst->sm.mask][m];
}
return;
}
We can see three layers of loops, that are most likely deeply nested in a lot of other loops in the outer functions. This is why any small change to the code inside the loops can potentially have a tremendous effect on the overall performance. Let’s look at the output of the time measurements for this part of the code:
[DNN-PROFILER] Time for MGC MLPG: 1353ms.
[DNN-PROFILER] Time for MGC MLPG: 1342ms.
[DNN-PROFILER] Time for MGC MLPG: 1328ms.
...
The first thing that is obvious is the access to
pst->sm.P[v - u][(pst->sm.t + u) & pst->sm.mask][m]
which happens twice. First it is accessed to subtract a value from it, then the result is again accessed to write it to another location.
As a small detour, let’s look at this part:
if (v != u)
pst->sm.P[u - v][(pst->sm.t + v) & pst->sm.mask][m] =
pst->sm.P[v - u][(pst->sm.t + u) & pst->sm.mask][m];
I’ve shifted the third line to the left so it can clearly be seen that what happens here is that sm.P seems to hold symmetric values. It’s also evident that either (u-v) or (v-u) is negative when (v != u), which means that the symmetry of sm.P is before and after sm.P[0]. This means that you have to be very careful when freeing the memory block.
For optimization this means that we can avoid accessing that value twice by pulling it out into a local variable:
static void update_P(PStream* pst) {
for (m = 0; m <= pst->order; ++m) {
for (u = -pst->range; u <= pst->dw.maxw[WRIGHT]; ++u) {
for (v = u; v <= pst->dw.maxw[WRIGHT]; ++v) {
auto& val = pst->sm.P[v - u][(pst->sm.t + u) & pst->sm.mask][m];  // <- local variable val -= pst->sm.k[v][m] * pst->sm.pi[u][m];
if (v != u) {
pst->sm.P[u - v][(pst->sm.t + v) & pst->sm.mask][m] = val;
}
}
}
}
}
So after pulling out the value into a local variable, we run our code again:
[DNN-PROFILER] Time for MGC MLPG: 1185ms.
[DNN-PROFILER] Time for MGC MLPG: 1169ms.
[DNN-PROFILER] Time for MGC MLPG: 1187ms.
...
Not to bad.
But what is even more important:
pst->sm.P[u – v][idx] is accessed with index m, index m is incremented in the outermost loop.
So what happens here is that we don’t access our memory contiguously.
Looking at the code again we can see that the outermost loop can be moved to the inside:
static void update_P(PStream* pst) {
for (u = -pst->range; u <= pst->dw.maxw[WRIGHT]; ++u) {
for (v = u; v <= pst->dw.maxw[WRIGHT]; ++v) {
for (m = 0; m <= pst->order; ++m) {    // <- now the inner loop auto idx = (pst->sm.t + u) & pst->sm.mask;
auto& val = pst->sm.P[v - u][idx][m];
val -= pst->sm.k[v][m] * pst->sm.pi[u][m];
if (v != u) {
pst->sm.P[u - v][idx][m] = val;
}
}
}
}
}
And then, running the code again:
[DNN-PROFILER] Time for MGC MLPG: 732ms.
[DNN-PROFILER] Time for MGC MLPG: 714ms.
[DNN-PROFILER] Time for MGC MLPG: 708ms.
...
Great!
We can see that accessing the memory in this order allows the prefetcher to do its work much better and we end up with the code being twice as fast by modifying 5 lines of code and without any understanding of what the function actually does. Taking the time to understand that opens up the option to rewrite it using a linear algebra library like Eigen.
Hi, I also want to use this skill to optimize mlpg in SPTK. However, the keywords “auto” and “&” is not used in C.
Hi, you are right, I integrated MLPG into a C++ codebase.
I suspect this value was a double, you you’d have to work with double* and add the appropriate referencing/dereferencing & and *s.
Not tested but should work like this:
double* val = &(pst->sm.P[v – u][(pst->sm.t + u) & pst->sm.mask][m]); // <- local variable val -= pst->sm.k[v][m] * pst->sm.pi[u][m];
if (v != u) {
pst->sm.P[u – v][(pst->sm.t + v) & pst->sm.mask][m] = *val;
}
Thanks. This works.